How to Find Market Direction in Share Market & Crypto
A Market Education Series by WPB MarketVoice (WebbersPro Business Network)
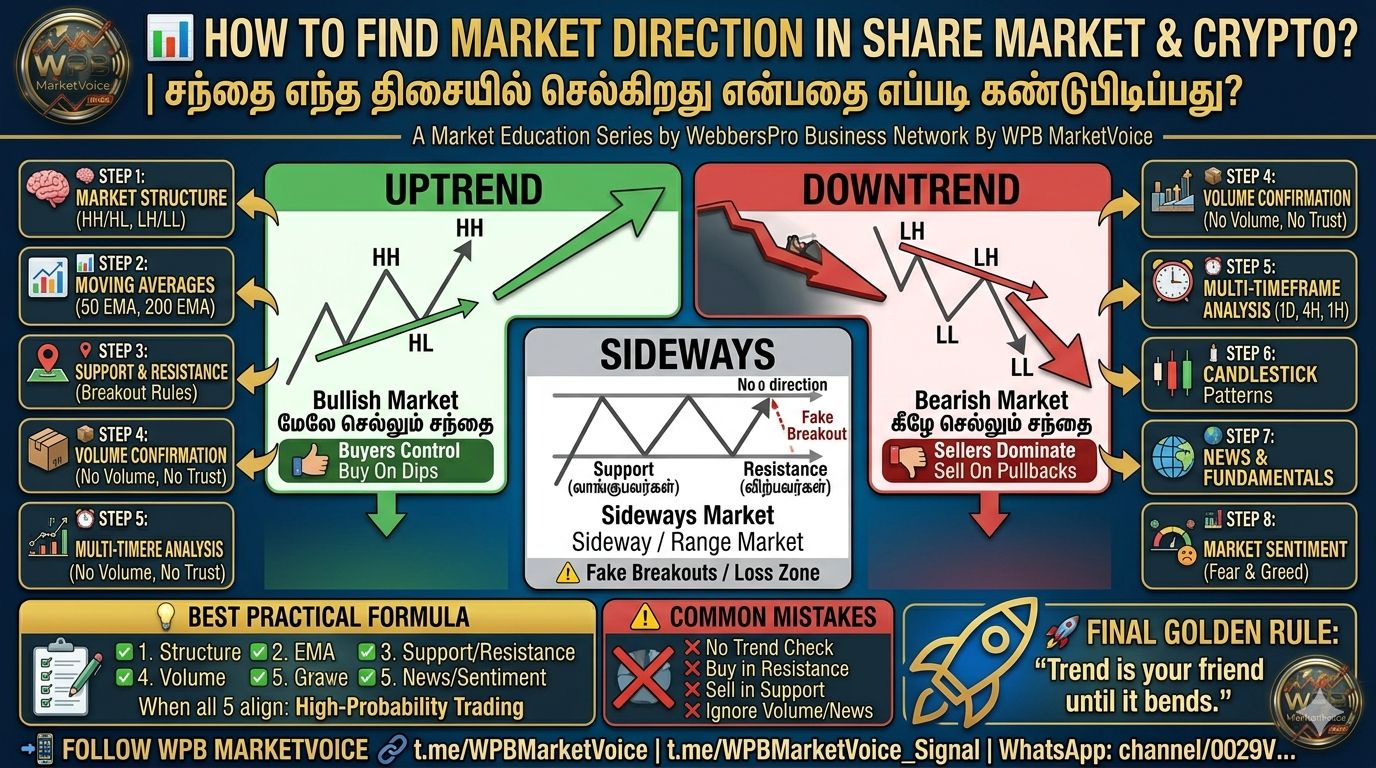
Before entering any trade, the first thing every trader must understand is: Is the market going UP, DOWN, or moving SIDEWAYS? சந்தை மேலே போகிறதா, கீழே போகிறதா, அல்லது Sideway-ஆ move ஆகிறதா? If you trade without knowing market direction, you will often enter at the wrong place. Professional traders identify the trend first, then look for entry points.
🟢 There are Only 3 Types of Market Direction
சந்தையில் மூன்று வகை திசை மட்டுமே இருக்கும்:
1. Bullish Market / Uptrend (மேலே செல்லும் சந்தை)
-
Structure: Price keeps making Higher Highs (HH) and Higher Lows (HL).
-
Meaning: Buyers are in control.
-
Best Strategy: Buy on dips / Pullback entries.
2. Bearish Market / Downtrend (கீழே செல்லும் சந்தை)
-
Structure: Price keeps making Lower Highs (LH) and Lower Lows (LL).
-
Meaning: Sellers are dominating.
-
Best Strategy: Sell on pullbacks / Avoid buying blindly.
3. Sideways Market / Range Market (சமநிலை சந்தை)
-
Structure: Price moves between a fixed area without a clear direction.
-
Warning: This is where most traders lose money due to "Fake Breakouts."
🛠️ Step-by-Step Guide to Identify Direction
Step 1: Identify Market Structure
Structure never lies.
-
Bullish: HH ➔ HL ➔ HH
-
Bearish: LH ➔ LL ➔ LH
-
Example: If BTC moves from 68k to 70k to 72k with rising lows, it is Bullish.
Step 2: Use Moving Averages (EMA)
One of the easiest ways to confirm a trend:
-
Bullish: Price stays above 50 EMA and 200 EMA.
-
Bearish: Price stays below 50 EMA and 200 EMA.
Step 3: Support & Resistance
-
Support: Where buyers step in (கீழே வாங்குபவர்கள் வரும் இடம்).
-
Resistance: Where sellers step in (மேலே விற்பவர்கள் வரும் இடம்).
-
Rule: A strong break above resistance is Bullish; a strong break below support is Bearish.
Step 4: Volume Confirmation
"No volume, no trust."
-
Price Up + Volume Up = Strong Trend.
-
Price Up + Low Volume = Weak move / Possible Fakeout.
📈 Professional Strategy: Multi-Timeframe Analysis
Don't make the mistake of looking at only one timeframe.
| Timeframe | Purpose | Tamil Context |
| 1 Day (Daily) | Main Trend | முக்கிய trend-ஐ பார்க்க |
| 4 Hour (4H) | Setup | Pullback & Support பார்க்க |
| 1 Hour (1H) | Entry | Confirmation உடன் entry எடுக்க |
📰 News & Market Sentiment
Technical analysis is only half the story.
-
Share Market: Watch Interest rates, Inflation (CPI), and Company earnings.
-
Crypto: Watch ETF news, Bitcoin Dominance, and Whale activity.
-
Psychology: Check the Fear & Greed Index. Sometimes the chart looks bullish, but the sentiment is "Extreme Fear"—be careful!
🚫 Common Mistakes to Avoid
-
Ignoring the Trend: Trading against the main direction.
-
Buying at Resistance: Entering exactly where sellers are waiting.
-
No Volume Check: Trusting a price move that has no backing.
-
Gambling: Entering a trade without knowing if the market is Bullish or Bearish.
💡 Final Golden Rule
"Trend is your friend until it bends."
சந்தையோடு சண்டை போடாதீர்கள். Guess பண்ணாதீர்கள். Chart என்ன காட்டுகிறதோ அதை follow பண்ணுங்கள்.
Once the direction is clear, your entries, exits, and confidence will naturally improve.
🔗 Follow WPB MarketVoice for More Insights
Stay updated with smart trading education and signals:
-
📢 Main Channel: Join Telegram
-
🎯 Signals Channel: Get Signals
-
💬 WhatsApp: Follow on WhatsApp
#WPBMarketVoice #CryptoTrading #ShareMarket #TechnicalAnalysis #TradingEducation #TamilTrading
Comments (0)
Leave a Comment
Be the first to comment!